Review of 2023
2023 is over, it’s time to crunch some numbers.
I’ll share with you the numbers of my families energy consumption and \(CO_2\) footprint of 2023. Our household consists of two adults, three kids and a cat.
In case you know your numbers and are open about it, feel free to share and compare them in the comment section.

Energy consumption
This are the direct consumptions of the household that I was able to track - like an ESG Scope 1 measure.
Electricity
| Consumption in kWh 1 | 2023 | 2022 | - / + |
|---|---|---|---|
| Heat pump (hot water & heating) | 1695 | 1919 | -224 (12%)* |
| Household | 2625 | 2999 | -374 (12%)** |
Both electricity sources are renewable.
* main savings result from reducing the overall room temperature by 2°C
** some of the savings result from replacing the old dryer
Car
| Consumption | 2023 | 2022 | - / + |
|---|---|---|---|
| Distance in kilometer 2 | 10047 | 11975 | -1928 (16%) |
| Diesel in liter | 673 | 802 | -129 (16%) |
| \(CO_2\) emissions of Diesel in t 3 | 2.05 | 2.44 | -0.39 (16%) |
The average Diesel consumption ranges from 0.065 to 0.067 l/km.4 The calculations are done with 0.067 l/km.
\(CO_2\) footprint
The emissions are calculated using “CO2-Rechner Des Umweltbundesamtes” (2024), a \(CO_2\) calculator provided by the German Government.
Household emission
| Category | \(CO_2\) emission in t 5 | \(CO_2\) emission in t p.P. | Consumption |
|---|---|---|---|
| House | 1.45 | 0.29 | |
| Heating | 0.05 | 0.01 | 1695 kWh |
| Electricity | 0.07 | 0.01 | 2625 kWh |
| Housing total | 1.57 | 0.31 | |
| Car | 0.35 | 0.07 | |
| Car mileage | 2.05 | 0.41 | 10047 km |
| Carpool | 0.16 | 0.03 | 1000 km |
| Public Transportation | 0.14 | 0.03 | 2793 km |
| Transportation total | 2.62 | 0.52 | |
| Food | 6.9 | 1.38 | reduced meat, preferred local |
| General Consumption | 18.45 | 3.69 | default estimate |
| Public Emissions | 5.75 | 1.15 | default estimate |
| Total | 35.37 | ||
| Total per person | 7.07 |
Personal emission
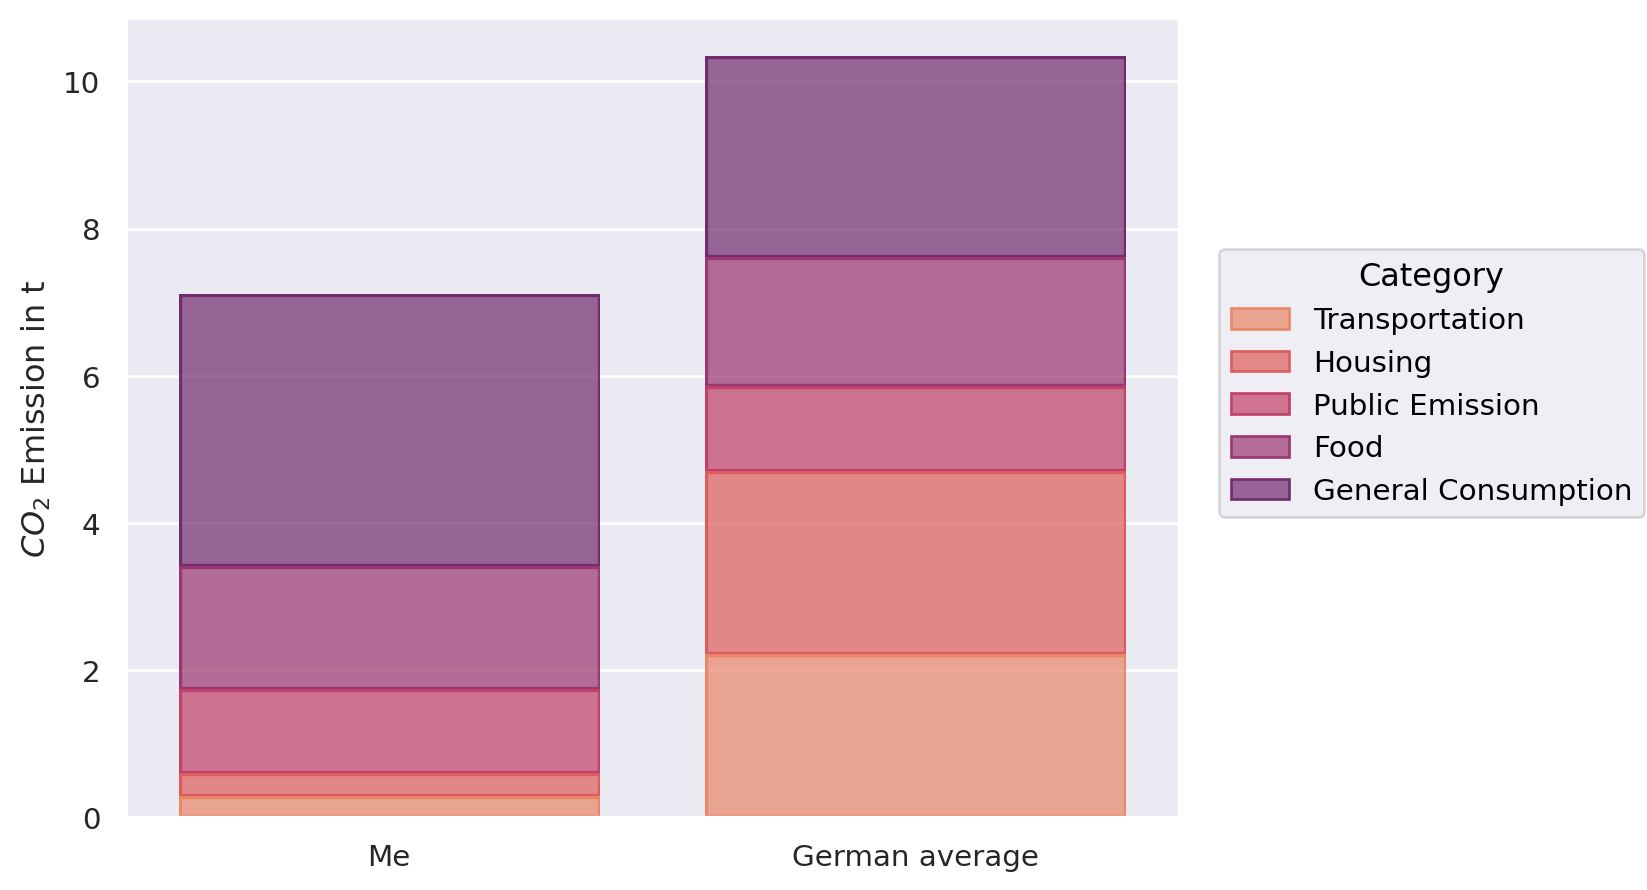
| Category | \(CO_2\) emission in t 6 | German average 7 | - / + |
|---|---|---|---|
| Housing | 0.31 | 2.49 | -2.18 (88%) |
| Transportation | 0.92 | 2.22 | -1.3 (59%) |
| Food | 1.67 | 1.75 | -0.08 (5%) |
| General Consumption | 3.69 | 2.73 | +0.96 (35%) |
| Public Emissions | 1.15 | 1.15 | 0 (0%) |
| Total | 7.74 | 10.34 | -2.6 (25%) |
Conclusion
Options to further reduce my consumption significantly are limited.
- The biggest contribution is General Consumption which is a general estimate depending on our household income. The assumption is: the more you earn the more you consume.
- The second biggest block is Food. This could be improved by reducing dairy and meat.
- The third block Public Emission covers infrastructure, industry, etc. and is hard to influence on an individual level.
- The Housing category is already quite low because of good insulation and energy efficient heating.
- The Transportation category was low because the five of us share one car. We did few traveling and due to a work from home policy I spend few kilometers commuting.
I firmly believe that the only way to improve life or reduce consumption is by implementing habits into your daily life that are not causing much effort, like enjoying a walk to the bakery instead of squeezing into a car. For bigger changes to work, like installing a PV system, there must be an economic incentive, like a quick armortization and low opportunity costs.
- Default to not taking the car.
- Watch out for inefficient electrical devices, like an old dryer. In my case it was much cheaper to replace my broken 15 year old dryer with a new energy efficient one instead of repairing it.
- Don’t just buy things because thy are efficient. Buying a new car every three years is probably not very \(CO_2\) efficient, no matter how advanced the battery is.
- Rule of thumb: Electronics and machines are good for efficiency at work. Outside of work they have lots of downsides: they cost lots of money, the lead to high emissions, they often are noisy, mostly they weaken your body.
That said, time to switch of my computer and unfold the drying rack, lol.
Bye 😉
References
Footnotes
The data is taken from the electricity meters.↩︎
Data is taken from car mileage display.↩︎
\(CO_2\) emissions of Diesel is calculated via “CO2-Rechner Des Umweltbundesamtes” (2024)↩︎
Data is taken from car mileage display.↩︎
- Default values are taken for the categories General Consumption and Public Emissions.
- Mileage for Carpool and Public Transportation are approximated.
- Category Food is calculated depending on age and diet.
Personal emission is either calculated by household emission divided by five (Housing, General Consumption, Public Emissions) or by the actual values (Transportation, Food).↩︎
German average is taken from “CO2-Rechner Des Umweltbundesamtes” (2024).↩︎